Difference between revisions of "Fluorometer"
Cmditradmin (talk | contribs) m (→Significance) |
Cmditradmin (talk | contribs) m (→Significance) |
||
| Line 38: | Line 38: | ||
'''Choice of excitation wavelength''' | '''Choice of excitation wavelength''' | ||
The excitation wavelength should be within the absorption band of the compounds.The same excitation wavelength is used for reference and sample compounds. The emission spectrum is collected on the long wavelength side of the excitation wavelength (to avoid strong scattered light from excitation beam). | [[Image:Fluor_spectrum.png|thumb|300px| Excitation wavelength should be within the absorption band of the compounds | ||
]] | |||
The excitation wavelength should be within the absorption band of the compounds. The same excitation wavelength is used for reference and sample compounds. The emission spectrum is collected on the long wavelength side of the excitation wavelength (to avoid strong scattered light from excitation beam). | |||
In this test, we are using: λ<sub>exc</sub> = 350 nm | In this test, we are using: λ<sub>exc</sub> = 350 nm | ||
'''Repeated measurements''' | '''Repeated measurements''' | ||
Deviations from linearity could indicate that emission was affected by reabsorption | Its always a good idea to have multiple data points! Prepare multiple dilutions and then measure fluorescence emission spectrum of each solution. Determine the slope of the line F/A for sample and reference. Deviations from linearity could indicate that emission was affected by reabsorption | ||
'''Reabsorption''' | '''Reabsorption''' | ||
Reabsorption is the absorption of the emitted light by the same solution before light exits cuvette. This is more significant for compounds with small Stokes shifts. Reabsorption can appear as a redshift (or decrease in fluorescence intensity on the short wavelength portion of the spectrum). The effect can be minimized by reducing concentration of solution. | |||
<br clear='all'> | |||
Reabsorption can appear as a redshift (or decrease in fluorescence intensity on the short wavelength portion of the spectrum) | |||
'''Corrected fluorescence spectra''' | '''Corrected fluorescence spectra''' | ||
Detectors and gratings do not have the same efficiency at all wavelengths | [[Image:Solvent_subtraction.png|thumb|300px| ]] | ||
Detectors and gratings do not have the same efficiency at all wavelengths. Therefore the results need to be corrected by a factor that accounts for wavelength response of the instrument. The contribution of the solvent (Raman scattering) and noise (dark counts) should also be subtracted. | |||
The contribution of the solvent (Raman scattering) and noise (dark counts) should also be subtracted | |||
'''Sample Calculation''' | '''Sample Calculation''' | ||
F/A values n | F/A values n | ||
Revision as of 11:38, 28 February 2011
Background
Significance
Fluorescence quantum yield determination using relavitive method
One significant use of the fluorometer (or fluorimeter) is the determination of the fluorescence quantum yield. This is done using a relative method based on a reference compound of known quantum yield. The unknown sample and the reference sample are measured at the same excitation wavelengths and measurement conditions. The wavelength-integrated flourescent intensity of both materials are then used in the calculation:
- <math>\phi = \phi_{reference} \frac {F_{sample} / A_{sample}} {F_{reference}/ A_{reference}} \left( \frac {n_{sample}} {n_{reference}} \right) ^2\,\!</math>
where
φ is the quantum yield
F= integrated fluorescence intensity
A= absorbance at excitation wavelength
n= refractive index
Optically dilute solution
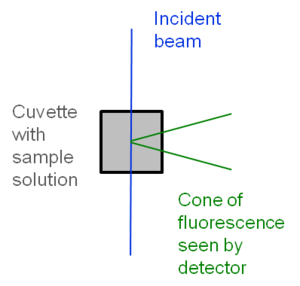
The intensity of the excitation beam should be almost constant along excitation beam. The fluorescence signal is proportional to intensity of excitation beam and the intensity has to be the same for sample and reference.
Typically: A ≤ 0.02 over 1 cm pathlength
From entrance face to center of cuvette: A = 0.01
T= 10-A = 10-0.01= 0.977
Therefore the intensity has changed only by 2%
Depending on absorption spectrometer used, measurement of A in this range may not be accurate enough. How to proceed?
- Measure A on higher concentration solution
- Dilute solution by (accurately) known factor
- Perform fluorescence measurement on diluted solutions
Choice of excitation wavelength
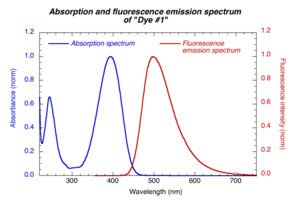
The excitation wavelength should be within the absorption band of the compounds. The same excitation wavelength is used for reference and sample compounds. The emission spectrum is collected on the long wavelength side of the excitation wavelength (to avoid strong scattered light from excitation beam).
In this test, we are using: λexc = 350 nm
Repeated measurements
Its always a good idea to have multiple data points! Prepare multiple dilutions and then measure fluorescence emission spectrum of each solution. Determine the slope of the line F/A for sample and reference. Deviations from linearity could indicate that emission was affected by reabsorption
Reabsorption
Reabsorption is the absorption of the emitted light by the same solution before light exits cuvette. This is more significant for compounds with small Stokes shifts. Reabsorption can appear as a redshift (or decrease in fluorescence intensity on the short wavelength portion of the spectrum). The effect can be minimized by reducing concentration of solution.
Corrected fluorescence spectra
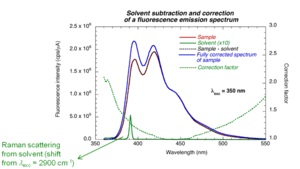
Detectors and gratings do not have the same efficiency at all wavelengths. Therefore the results need to be corrected by a factor that accounts for wavelength response of the instrument. The contribution of the solvent (Raman scattering) and noise (dark counts) should also be subtracted.
Sample Calculation F/A values n Sample (#1): 1.289 x 10¹⁰ cps/mA 1.3288 (methanol) Reference: 1.316 x 10¹⁰ cps/mA 1.4266 (cyclohexane) φreference = 0.87)
- <math>\phi = \phi_{reference} \frac {F_{sample} / A_{sample}} {F_{reference}/ A_{reference}} \left( \frac {n_{sample}} {n_{reference}} \right) ^2\,\!</math>
- <math>\phi = 0.87 * \frac {1.289} {1.316} * \left( \frac {1.3288} {1.4266} \right) ^2\,\!</math>


