Difference between revisions of "Photoelectron Spectrometer XPS and UPS"
Cmditradmin (talk | contribs) |
Cmditradmin (talk | contribs) |
||
| Line 11: | Line 11: | ||
[[Image:Surface_electron_spectroscopies.jpg|thumb|right|300px |XPS uses high energy X-ray photons to excite “core” electrons in the near-surface region UPS uses lower energy photons in the deep UV region to excite valence electrons.]] | [[Image:Surface_electron_spectroscopies.jpg|thumb|right|300px |XPS uses high energy X-ray photons to excite “core” electrons in the near-surface region UPS uses lower energy photons in the deep UV region to excite valence electrons.]] | ||
We use high-vacuum surface electron spectroscopies: X-ray photoelectron spectroscopy (XPS)and UV-photoelectron spectroscopy (UPS) to provide the elemental, molecular and energetic information we require about these materials.Surface analysis is carried out in high vacuum spectrometers, with sophisticated sample handling capabilities. The sample is prepared in a chamber to which a variety of devices can be attached. The idea is to keep the surface as clean as possible, and to selectively add monolayers of organic materials to these surfaces, without the need to break vacuum between analyses.The sample is located at the center of the analytical chamber, and positioned so that we can excite it with either X-rays or UV photons.Once the photoelectrons are ejected from the sample, they are collected by a series of focusing lenses, and then separated according to their kinetic energy in a “hemispherical” analyzer. We use either a single “channeltron” detector (UPS) or a multi-channel detector(XPS) | We use high-vacuum surface electron spectroscopies: X-ray photoelectron spectroscopy (XPS)and UV-photoelectron spectroscopy (UPS) to provide the elemental, molecular and energetic information we require about these materials.Surface analysis is carried out in high vacuum spectrometers, with sophisticated sample handling capabilities. The sample is prepared in a chamber to which a variety of devices can be attached. The idea is to keep the surface as clean as possible, and to selectively add monolayers of organic materials to these surfaces, without the need to break vacuum between analyses.The sample is located at the center of the analytical chamber, and positioned so that we can excite it with either X-rays or UV photons.Once the photoelectrons are ejected from the sample, they are collected by a series of focusing lenses, and then separated according to their kinetic energy in a “hemispherical” analyzer. We use either a single “channeltron” detector (UPS) or a multi-channel detector(XPS) | ||
| Line 19: | Line 16: | ||
<swf width= "640" height="480">http://depts.washington.edu/cmditr/media/pes.swf</swf> | <swf width= "640" height="480">http://depts.washington.edu/cmditr/media/pes.swf</swf> | ||
<br clear="all"> | <br clear="all"> | ||
| Line 32: | Line 27: | ||
Image:Xpsspectra.jpg|These high resolution XPS spectra show the power of the technique for the characterization of ITO surfaces with different PA modifiers. Note especially the C(1s) spectra region in (b) where we observe several different peaks due to carbon in its various forms within each molecule. The peak with a binding energy (BE) of ca. 285 eV is due to carbon in the backbone of the molecule, whereas higher BE peaks are seen for carbon bonded to fluorine (see the peaks at 291 and 293 eV for FHOPA). Similar molecular differences are seen in the O(1s) (a) P(2p) and In(4s) © and F(1s) spectral regions. | Image:Xpsspectra.jpg|These high resolution XPS spectra show the power of the technique for the characterization of ITO surfaces with different PA modifiers. Note especially the C(1s) spectra region in (b) where we observe several different peaks due to carbon in its various forms within each molecule. The peak with a binding energy (BE) of ca. 285 eV is due to carbon in the backbone of the molecule, whereas higher BE peaks are seen for carbon bonded to fluorine (see the peaks at 291 and 293 eV for FHOPA). Similar molecular differences are seen in the O(1s) (a) P(2p) and In(4s) © and F(1s) spectral regions. | ||
Image: Ups_au_graph.jpg|Using UV photons as the excitation source we probe photoelectrons emitted from the valence band region of our materials of interest. Here for example is a UPS spectrum (He(I) excitation) for a clean gold surface. The regions of most interest are the high kinetic energy photoelectrons, and the energy where we begin to detect them (red line) and the low kinetic energy electrons and the lowest energy where they can be detected (blue line). The energy difference between these two threshold energies (w), subtracted from the source energy (21.2 eV) gives us an estimate of the effective surface work function of this material – in this case the work function for clean Au is about 5.1 eV. | |||
Image: Ups_au_plus_alkane.jpg|Now we have added a single monolayer of an alkane thiol modifier, which binds strongly to the Au surface, and changes the UPS spectrum, the effective work function of the Au surface. This modifier is a 12-carbon chain, terminated with a phenyl group, and we see a new ionization peak (orange) for the ionization of these phenyl groups. The width of the photoemission spectrum has changed as well, indicating a new work function for this modified Au surface. | |||
</gallery> | </gallery> | ||
Revision as of 12:57, 22 April 2009
X-ray Photoelectron Spectroscopy and UV Photoelectron Spectroscopy are techniques for studying the surface characteristic of materials.
What is the Problem?
OLEDs and OPVs consist of thin films of organic materials, sandwiched between contacting electrodes. We need analytical tools which tell us:
- Elemental composition of metal, metal oxide and organic surfaces (top 1-10 nm)
- The molecular state of those elements in that same region
- The frontier orbital energies which control rates of charge transfer, photopotentials, onset voltages, etc.
What is our approach? Physics of XPS and UPS

We use high-vacuum surface electron spectroscopies: X-ray photoelectron spectroscopy (XPS)and UV-photoelectron spectroscopy (UPS) to provide the elemental, molecular and energetic information we require about these materials.Surface analysis is carried out in high vacuum spectrometers, with sophisticated sample handling capabilities. The sample is prepared in a chamber to which a variety of devices can be attached. The idea is to keep the surface as clean as possible, and to selectively add monolayers of organic materials to these surfaces, without the need to break vacuum between analyses.The sample is located at the center of the analytical chamber, and positioned so that we can excite it with either X-rays or UV photons.Once the photoelectrons are ejected from the sample, they are collected by a series of focusing lenses, and then separated according to their kinetic energy in a “hemispherical” analyzer. We use either a single “channeltron” detector (UPS) or a multi-channel detector(XPS)

<swf width= "640" height="480">http://depts.washington.edu/cmditr/media/pes.swf</swf>
Data interpretation

Here is a typical “survey spectrum” for a clean gold surface, modified with a single monolayer of a phenyl-terminated alkanethiol. We plot number of emitted photoelectrons on the y-axis, and their binding energy (BE) or kinetic energy (KE) on the x-axis. The photoelectric effect applies (as first described by Einstein) – there is conservation of energy, and you can see that the BE of each photoelectron is related to the excitation source energy, the measured kinetic energy of that photoelectron, and a “work function” of the spectrometer (constant). Each element provides us with at least one photoemission peak, with a distinct BE or KE.
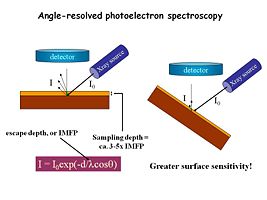
XPS is typically conducted with the sample perpendicular to the detector axis (normal takeoff angles) but if we want additional near-surface sensitivity we can tilt the sample. The above equation shows that tilting the sample gives us analytical information even closer to the surface
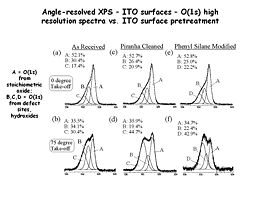
Spectra a,c and e are “normal takeoff” angle spectra of the O(1s) region from indium tin oxide surfaces that have been subjected to various pretreatments. Spectra b,d and f are from the same samples, with high takeoff angles of analysis, giving more near-surface information. In this case we see new peaks from hydroxyl (-OH) species located right at the surface of the oxide.
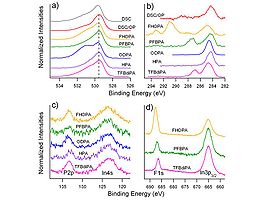
These high resolution XPS spectra show the power of the technique for the characterization of ITO surfaces with different PA modifiers. Note especially the C(1s) spectra region in (b) where we observe several different peaks due to carbon in its various forms within each molecule. The peak with a binding energy (BE) of ca. 285 eV is due to carbon in the backbone of the molecule, whereas higher BE peaks are seen for carbon bonded to fluorine (see the peaks at 291 and 293 eV for FHOPA). Similar molecular differences are seen in the O(1s) (a) P(2p) and In(4s) © and F(1s) spectral regions.
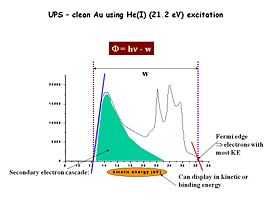
Using UV photons as the excitation source we probe photoelectrons emitted from the valence band region of our materials of interest. Here for example is a UPS spectrum (He(I) excitation) for a clean gold surface. The regions of most interest are the high kinetic energy photoelectrons, and the energy where we begin to detect them (red line) and the low kinetic energy electrons and the lowest energy where they can be detected (blue line). The energy difference between these two threshold energies (w), subtracted from the source energy (21.2 eV) gives us an estimate of the effective surface work function of this material – in this case the work function for clean Au is about 5.1 eV.
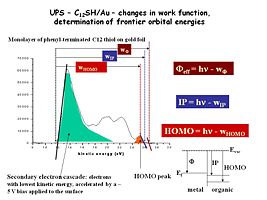
Now we have added a single monolayer of an alkane thiol modifier, which binds strongly to the Au surface, and changes the UPS spectrum, the effective work function of the Au surface. This modifier is a 12-carbon chain, terminated with a phenyl group, and we see a new ionization peak (orange) for the ionization of these phenyl groups. The width of the photoemission spectrum has changed as well, indicating a new work function for this modified Au surface.


